|
 |
 |
||||||||||||||||||||||||||
|
||||||||||||||||||||||||||||
|
|
||||||||||||||||||||||||||||
|
|
||||||||||||||||||||||||||||
|
|
|
|||||||||||||||||||||||||||
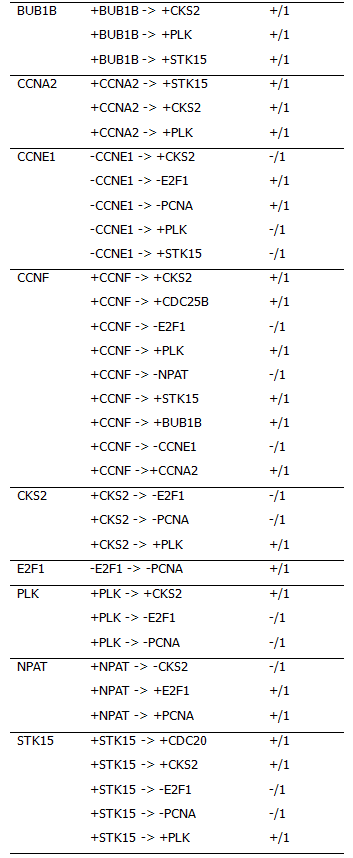
| Supplement 2 | ||||||||||||||||||||||||||||
|
|
||||||||||||||||||||||||||||
|
||||||||||||||||||||||||||||
|
||||||||||||||||||||||||||||
|
||||||||||||||||||||||||||||
|
|
|
|
|
|
|
|
||||||||||||||||||||||
|
|
|
|
||||||||||||||||||||||||||
|
||||||||||||||||||||||||||||
|
|
||||||||||||||||||||||||||||
|
|
||||||||||||||||||||||||||||
|
|
|
|||||||||||||||||||||||||||
| Supplement 2 | ||||||||||||||||||||||||||||
|
|
||||||||||||||||||||||||||||
|
||||||||||||||||||||||||||||
|
||||||||||||||||||||||||||||
|
||||||||||||||||||||||||||||
|
|
|
|
|
|
|
|
||||||||||||||||||||||