A gene regulatory relation often changes over time rather than being constant. But many gene
regulatory networks available in databases or literatures are static in the sense that they are either snapshots of
gene regulatory relations at a time point or union of successive gene regulations over time. Such static networks
cannot represent temporal aspects of gene regulatory interactions such as the order of gene regulations or the
pace of gene regulations.
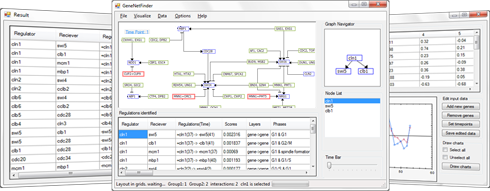
We have developed GeneNetFinder to qualitatively infer dynamic gene regulatory interactions from gene expression data. From the time-series data of gene expression, GeneNetFinder identifies not
only gene regulatory interactions but also the temporal aspects of the regulatory interactions. As for the
temporal aspect of gene regulatory relations, it identifies the order of the gene regulatory relations and the
pace of the relations. The identified gene regulatory interactions and their temporal aspects are stored in
the regulation list and visualized as a gene regulatory network. In the network visualized, gene regulations
and their temporal aspects are represented by edge types and edge labels.
Recent studies report that some genes tend to cooperate with others in playing a role of regulator of another gene although each of them does not have a regulatory relation with the target gene independently. This implies that some genes are not regulated by individual genes but rather by a combination of several genes. So far, most studies for finding gene regulations from gene expression data have focused on identifying regulatory relations between individual genes or co-regulated genes with the same regulator, so they cannot find gene regulatory relations with multiple activators or inhibitors.
In an effort to extend the first version of GeneNetFinder to gene regulatory relations with multiple regulating genes, we developed the second version of GeneNetFinder (hereafter called GeneNetFinder2) that identifies regulatory interactions between a group of genes and single genes as well as those between single genes.
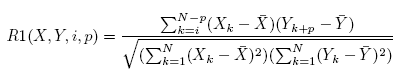
The regulatory interactions between genes are identified using scores: R1.
The regulatory relation between two genes is first evaluated using R1(X; Y; i; p) in Equation 1. R1 represents the correlation
between gene X at time point i and gene Y at time point i + p. p is the time span of the gene regulation.
In Equation 1, N is the total number of time points contained in the time span, Xk and Yk are the
expression levels of genes X and Y at time k, and X and Y are the average gene expression levels at all time
points of the time span. Among the total i X p candidate regulations, the regulation with the maximum
absolute value of R1(X; Y; i; p) > threshold d is selected as the regulatory relation between genes X and Y .
The R1 score of each gene regulation is iteratively calculated using Algorithm 1. For genes A and B, the regulation with the largest absolute R1 score is chosen for the regulation between the genes and represented as R1(A; B; t1; p) with t2 = t1 + p.
1. A time point with the minimum expression level of the regulator gene becomes a splitting point of
the time span.
2. Each sub-timespan starts with at least 3 consecutive time points that have a positive slope of a curve
representing gene expression levels, and ends with at least 3 consecutive time points with a negative
slope.
3. Each sub-timespan encompasses at least 6 time points, including the start and ending time points.
Identification of gene regulations with multiple regulators
We consider two types of multiple regulators in gene regulations.
Multiple-separate regulators have a same target gene, and each of the regulators has an individual regulatory relation with the target gene. The regulators X and Y which satisfy all the conditions below are grouped as multiple-separate regulators, and the regulation with multiple-separate regulators is denoted by {X, Y}->Z in the regulation list.
The regulators X and Y should have a same target gene Z.
The regulations X->Z and Y->Z must appear at the same time point.
The regulations must be of the same type (either activation or inhibition).
Multiple-combined regulators and their regulation are denoted by {X+Y}->Z. Unlike multiple-separate regulators, regulation by multiple-combined regulators X and Y cannot be found by examining individual gene regulations since individual gene regulations X->Z and Y->Z do not exist. Regulation by multiple-combined regulators is identified using the information on transcription factors of potential regulators and their binding to target genes.
Multiple-combined regulators X and Y of a target gene Z should satisfy the following conditions.
Individual regulatory relations X->Z and Y->Z do not hold (i.e., the relations are not included in the gene regulation list).
The transcription factors of X and Y should satisfy one of these:
Genes X and Y have a same transcription factor that binds to a target gene.
Genes X and Y have different transcription factors that constitute a cis-regulatory element and bind to a target gene in a promoter region.
All gene regulations identified are visualized as a 2-dimensional gene regulatory
network, in which a node represents a gene. Edge types and edge labels of the network represent gene
regulatory relations. Arrows represent inductive interactions (relations +A(t1) -> +B(t2) and -A(t1) ->
+B(t2)) and blocked arrows represent inhibitory interactions (relations +A(t1) -> -B(t2) and -A(t1) ->
-B(t2)). The regulator gene, type of regulation (+ for induction and - for inhibition), and time delay of
the regulation are annotated as edge labels. Each edge is labeled with R/s/T to indicate a regulator gene
R, sign s of the log-ratio of the expression level of R, and the time delay T of the regulation. For visualization of gene regulatory networks, three layout algorithms have been developed: grid layout, layered layout and circular layout.
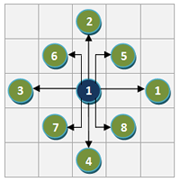
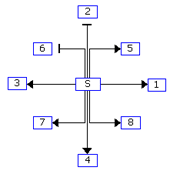
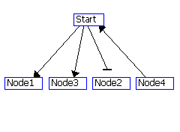
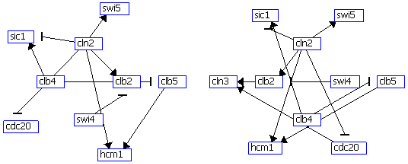
Figure 1: Example of grid layout. (A) Node S with the highest degree is place in the center grid, and the nodes connected to S are placed in the adjacent grids in the specified order. (B) Grid drawing by GeneNetFinder.
(A)
(B)
(C)
(D)
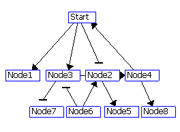
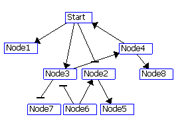
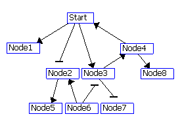
Figure 2: Visualization of the layered layout. (A) Put the node with the maximum degree at layer 1. If there is a tie, select a node with a higher out-degree. Assign the nodes connected the nodes at layer i to layer i+1.(B) 3. Repeat steps 1 and 2 for the remaining nodes. (C) If two nodes at the same layer are connected to each other, make a new layer between the layer and the upper layer and move the node with a smaller degree to the new layer (node 4 in C). Nodes with 0 out-degrees (node 1 in C) are also moved to the new layer. (D) Order the nodes in each layer by the Barycenter method to reduce the number of edge crossings
Figure3: Visualization of the circular layout. The circular layout algorithm places all nodes on a circle. Nodes with a higher degree are placed in an inner circle, and those with a lower degree are placed in an outer circle.
Copyright: Biocomputing Lab. All rights reserved. Visited:
Biocomputing Lab, Department of Computer Science and Engineering, Inha University.
Incheon, 402-751, South Korea. Phone: +82-32-8607388, Fax: +82-32-8634386